1、需要使用到的函数命令
anes(axes_handle)
这就是关于绘制坐标轴的命令
先打开matlab主程序。

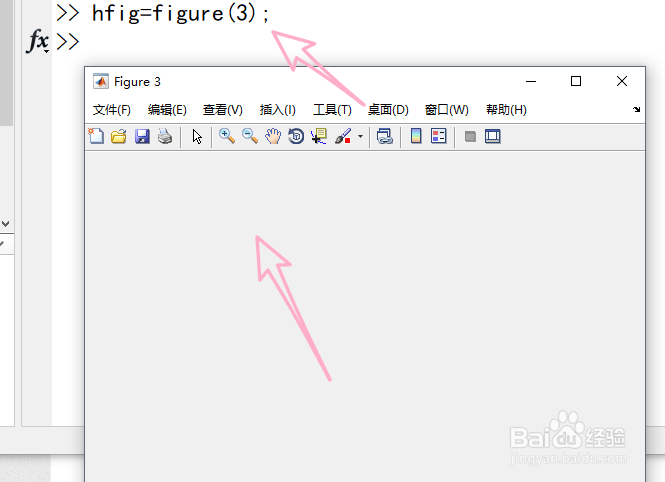
2、新建界面窗口,句柄设置必须为大于1的整数
hfig=figure(3)
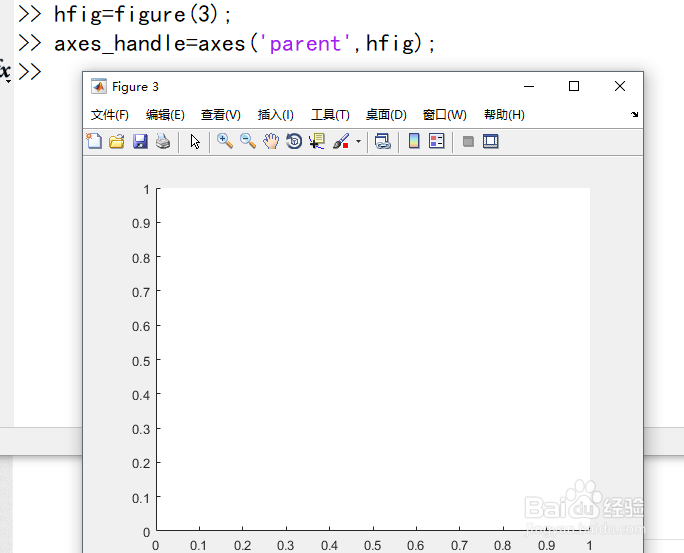
3、创建坐标轴,固定命令
axes_handle=axes('parent',hfig);
4、自定义一个函数,这里是三角函数为例
x=0:pi/100:2*pi;
y=cos(x);

5、指定当前坐标轴,即指定到句柄3
axes(axes_handle);

6、绘图,使用plot函数
plot(x,y);
